What it is
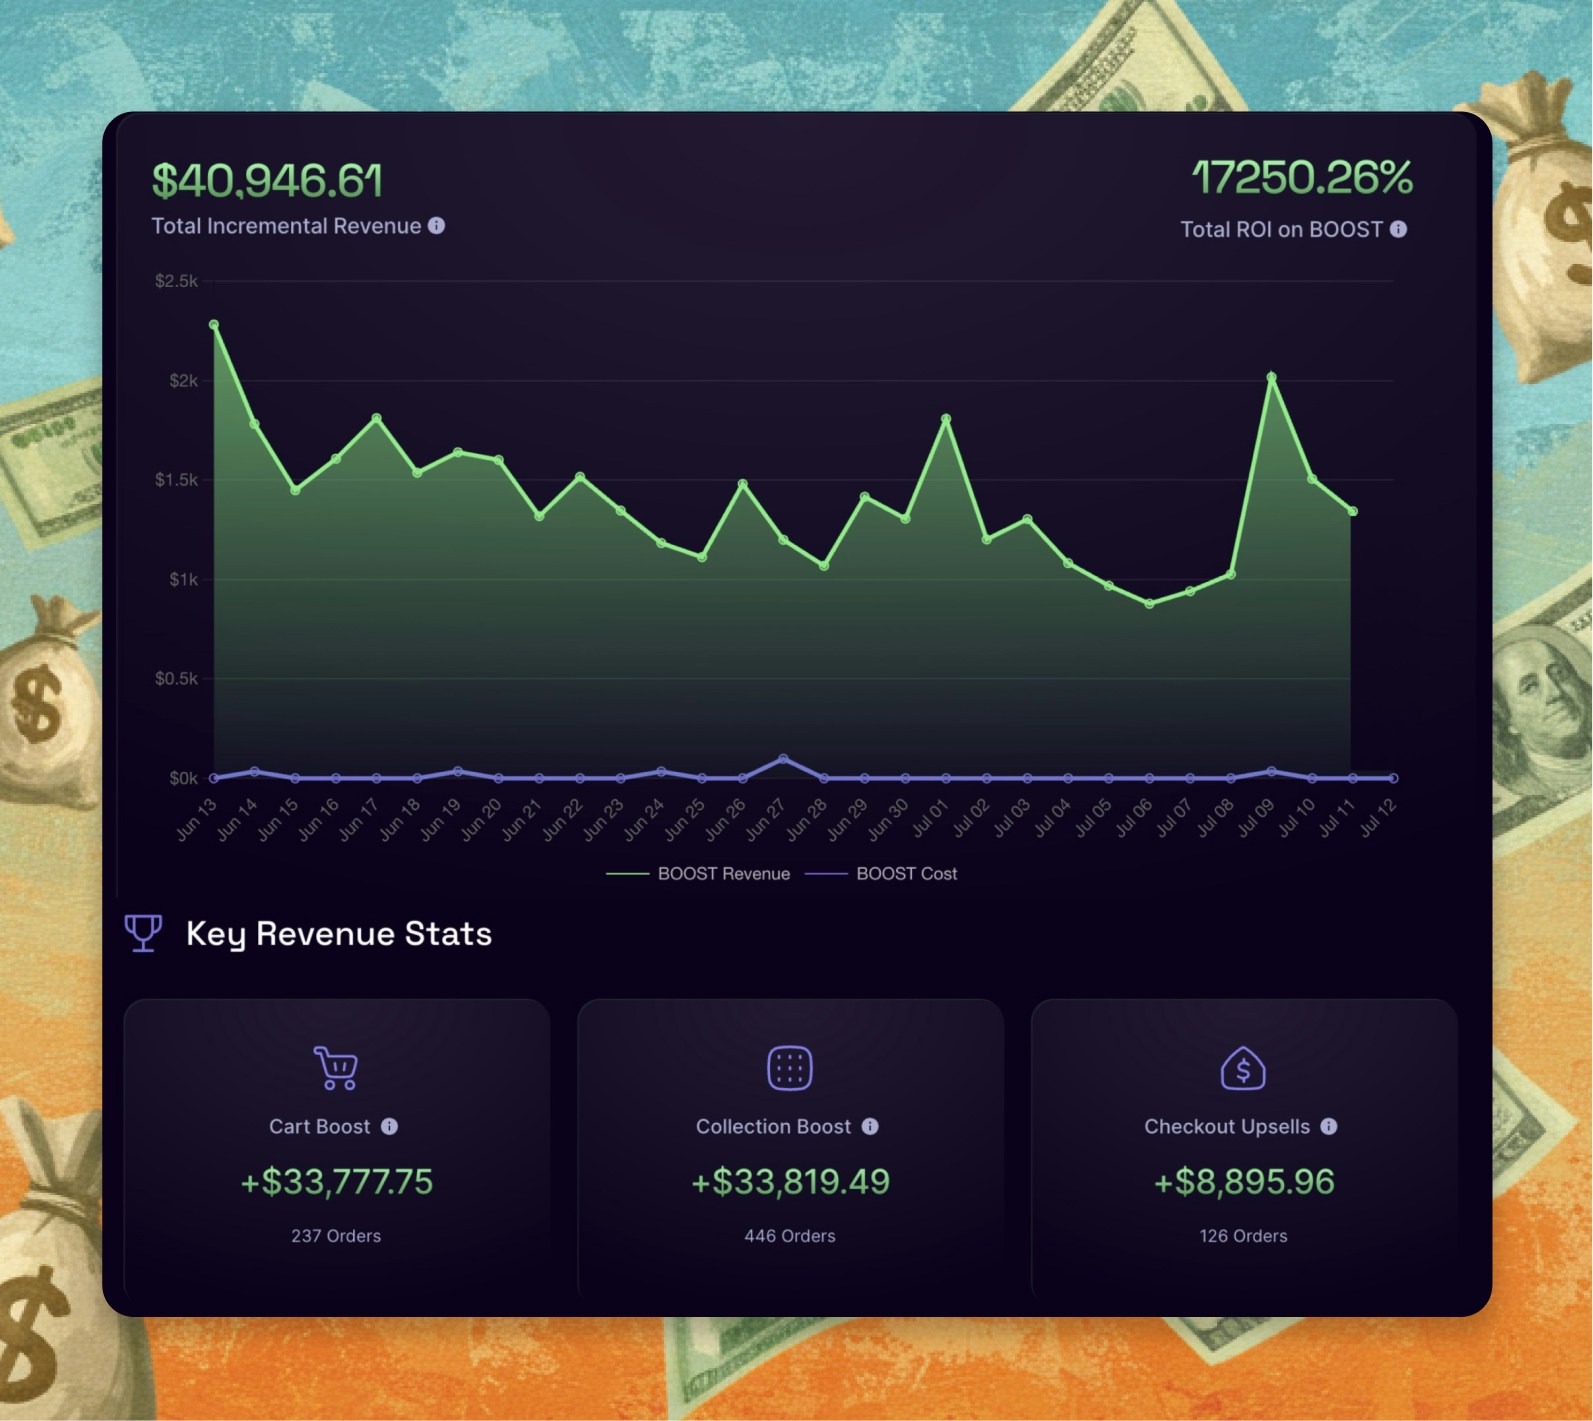
Moneyboard is the dashboard inside Boost where you see what you and Boost are earning together. Every sale Boost is part of — a reward tier that grew the order, a bundle, a checkout upsell, a switch to subscription — shows up as real dollars, next to what Boost costs you, so you always know your return. It’s not Boost taking credit. It’s your store’s growth, made with Boost’s tools — your wins, counted. And it’s included with every Boost plan, because seeing the money is the whole point.The problem it solves
Every growth app promises to make you money. Almost none of them show you whether they actually did:- You can’t tell what’s working. You’re running a cart app, an upsell app, a bundle app — and at month’s end you have a bigger Shopify number but no idea which tool helped earn it, or whether any of them paid for themselves.
- The numbers are usually a black box. Most apps show vanity metrics or bury the revenue that matters, so you’re left taking their word that they’re worth it.
- So you keep paying for tools you can’t measure. Without a clear number, every renewal is a leap of faith — and you can’t confidently decide what to add or cut.
How it works
Moneyboard turns everything you’re running on Boost into a straight answer — what you earned, what it cost, what’s working. 1. Pick a time range. Choose the window you want to see — today, this month, any range. 2. See the headline number. Your Boost-driven revenue, what Boost cost you, and your ROI — the return in plain dollars, right at the top. 3. Drill into each feature. See exactly what every part of Boost earned — cart reward tiers, bundles, checkout and post-purchase upsells, cross-sells, subscriptions, collections — with order counts and your top-performing products. 4. Find what’s left on the table. See which features are carrying your growth and which you haven’t switched on yet — so your next move is obvious, not a guess.What you get
- Your numbers, in plain dollars. The real revenue your store earns with Boost, broken out feature by feature — your scoreboard, not a vanity chart.
- Know what’s working. See which features drive your growth and which to push harder, so you stop guessing and start deciding.
- Your next move, made obvious. Moneyboard shows you the money you’re leaving on the table — the feature that would earn more the moment you switch it on.
- You and Boost, as a team. Moneyboard isn’t Boost bragging — it’s the proof of what your store achieves with Boost behind it, counted in dollars.
Works with your stack
- Is Moneyboard an extra cost? No — it’s included with every Boost plan. The proof comes free with the platform, because seeing the money is what makes Boost worth it.
- Whose revenue is this — Boost’s or mine? Yours. Moneyboard shows your store’s revenue, earned with Boost’s features — your wins, made with the tools, counted in plain dollars.
- Does it stay current? Yes — as orders come in, your Moneyboard reflects them, so the number is always up to date.
- Do I have to set anything up? No. Switch on Boost features and Moneyboard starts counting their revenue automatically.
Ready to see your money?
Switch on Boost, and watch your scoreboard fill in — your store’s revenue, earned feature by feature, in plain dollars.Continue to Explore
Cart
The best cart on Shopify — your biggest Moneyboard line.
Bundle Builder
Build-a-box orders, counted on your Moneyboard.
Paid Membership
A recurring revenue line you can watch grow in plain dollars.